Financial Tracking Reporting System Has Been Improved!
As Finanstakibi.com, we have improved our reporting system to provide our users with more comprehensive and detailed analyses! Now you will be able to examine your financial data in more depth, make comparisons according to different periods and create more customizable reports.
With the new developments, we present your reports in a more visualized way and make it easier for you to make sense of them. With advanced filtering options, you will be able to focus only on the data you need and track your past financial movements more effectively.
In addition, our reports are now faster and easier to use. Thanks to our user-friendly interface, you can analyze your financial situation instantly and make the right decisions.
Homepage Report
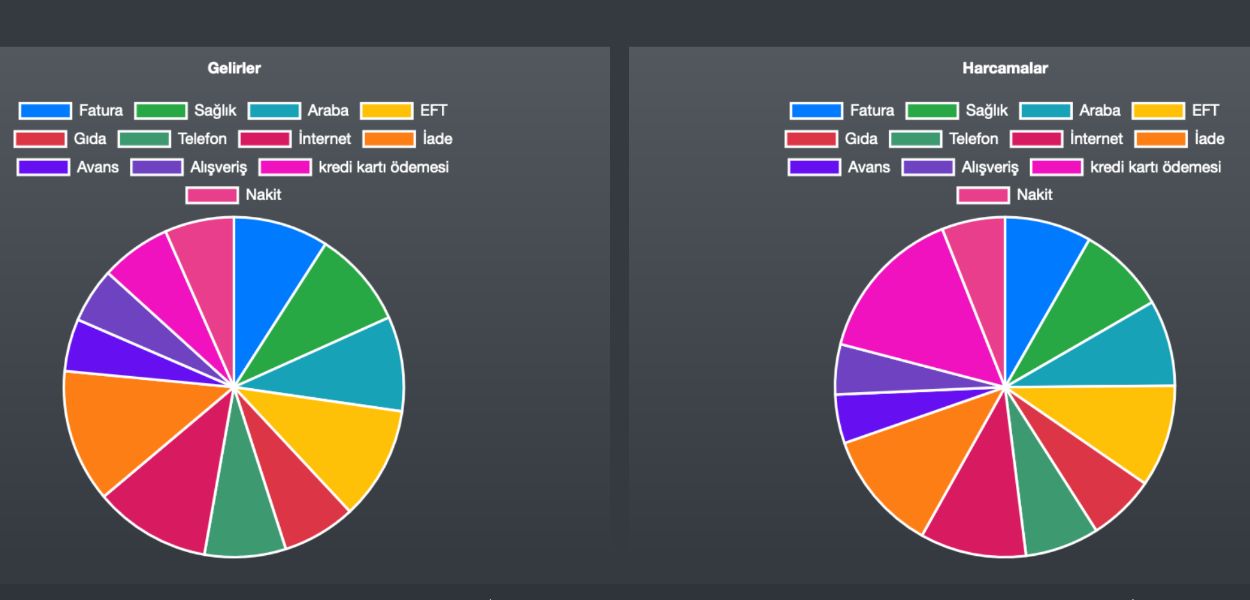
- Pie Chart Reports: Pie chart reports showing the slices of the labels are shown as two separate graphs Incomes and Expenses. In this way, you will be able to see your income and expenses with separate labels.
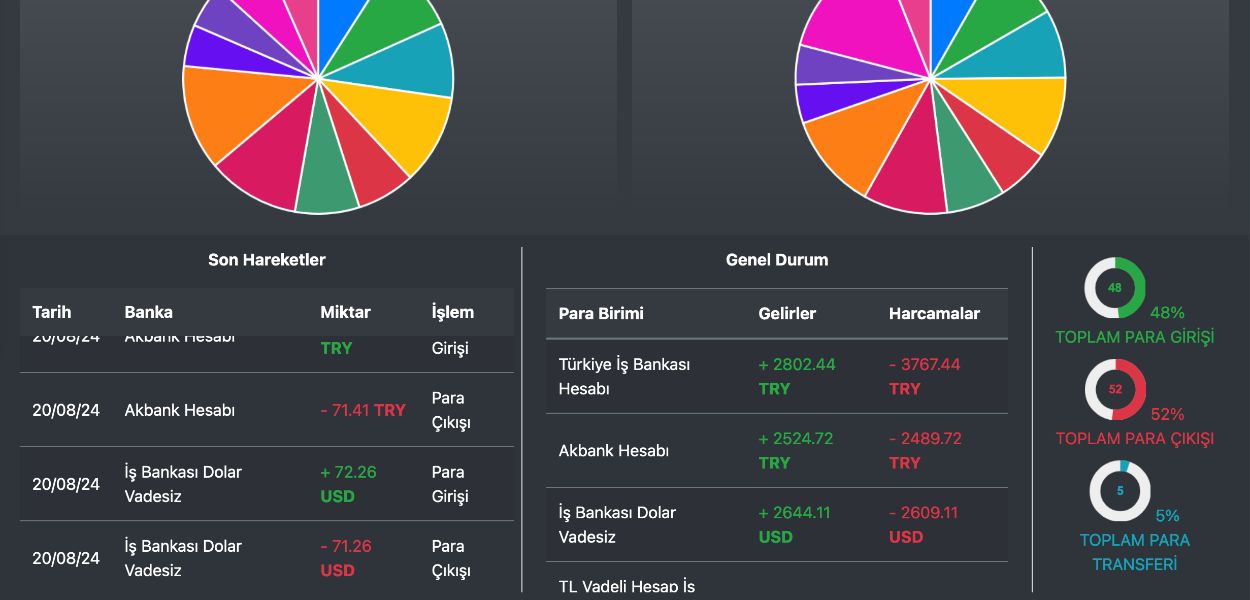
- General Status: By adding a new table called General Status, you will be able to see your total expenses and incomes in the last 1 month in all your accounts, all currencies in your wallet, or all your credit cards.
Account, Wallet, and Credit Card Detail Reports
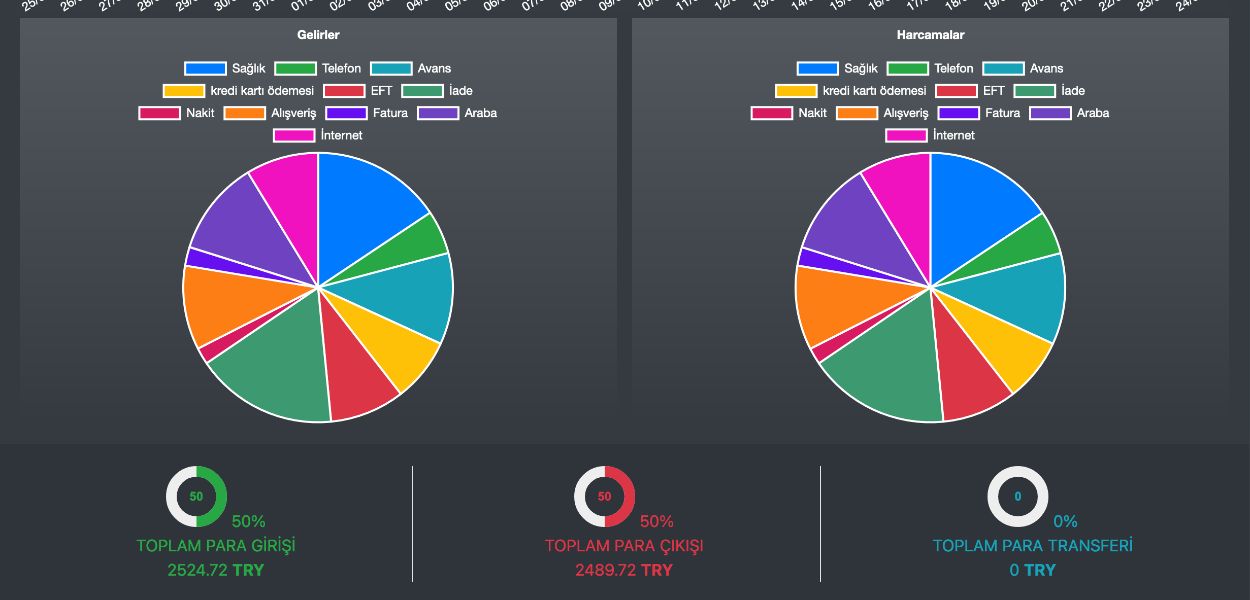
- Pie Chart Reports: Pie chart reports showing slices of labels, as in the homepage report, are shown as two separate graphs Incomes and Expenses. In this way, you will be able to see your income and expenditures with separate labels.
- Percentage Reports: In your wallet, in the details of your accounts, or in the details of your credit card, money amounts are added to percentage reports such as Total Money Input, Total Money Output, and Total Money Transfers, aiming to provide you with more detailed information.
Discover our new reporting features by logging in to Finanstakibi.com and get one step closer to your financial goals!