Guide to Bank Account Transaction Records
Finans Takibi allows you to track your financial situation by recording all financial transactions in your bank accounts in detail. This guide explains step by step how you can view and manage the transaction records of incomes, expenses, money transfers, and withdraws money to wallets you have made in your bank accounts.
Viewing Transaction Records
You can track all the money entries you have added to your bank accounts via the account details page.
- Go to the Bank Accounts Page: Click on "Accounts" from the left menu.
- View Account Transactions:
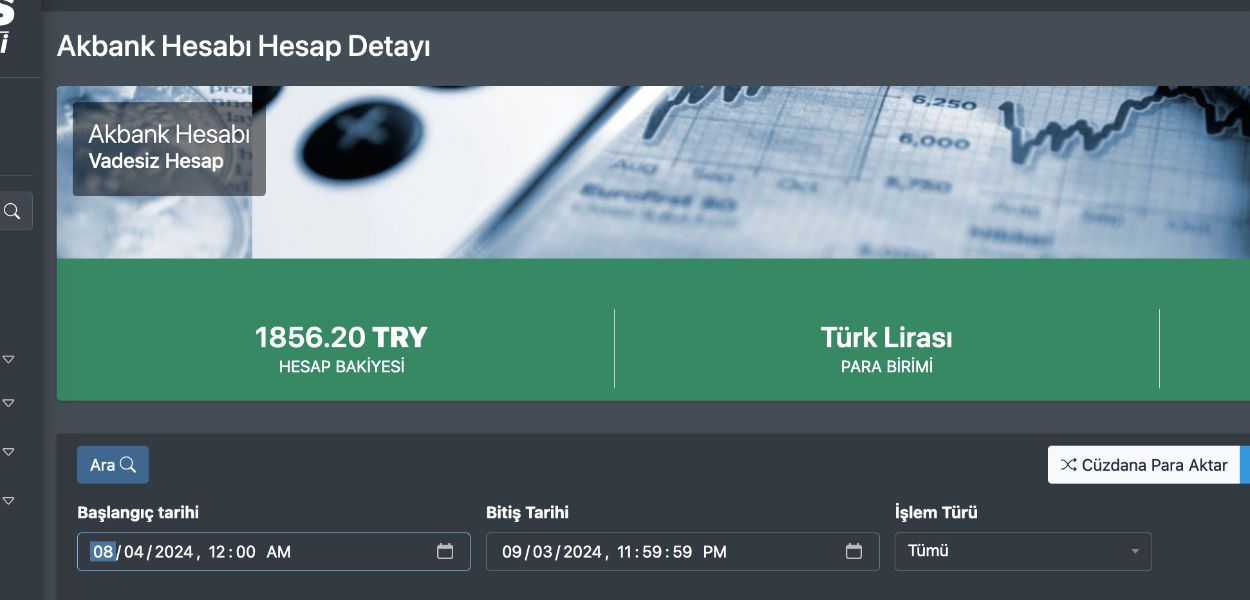
- Select the bank account whose transaction records you want to view and click on the "Go to Account Details" button.
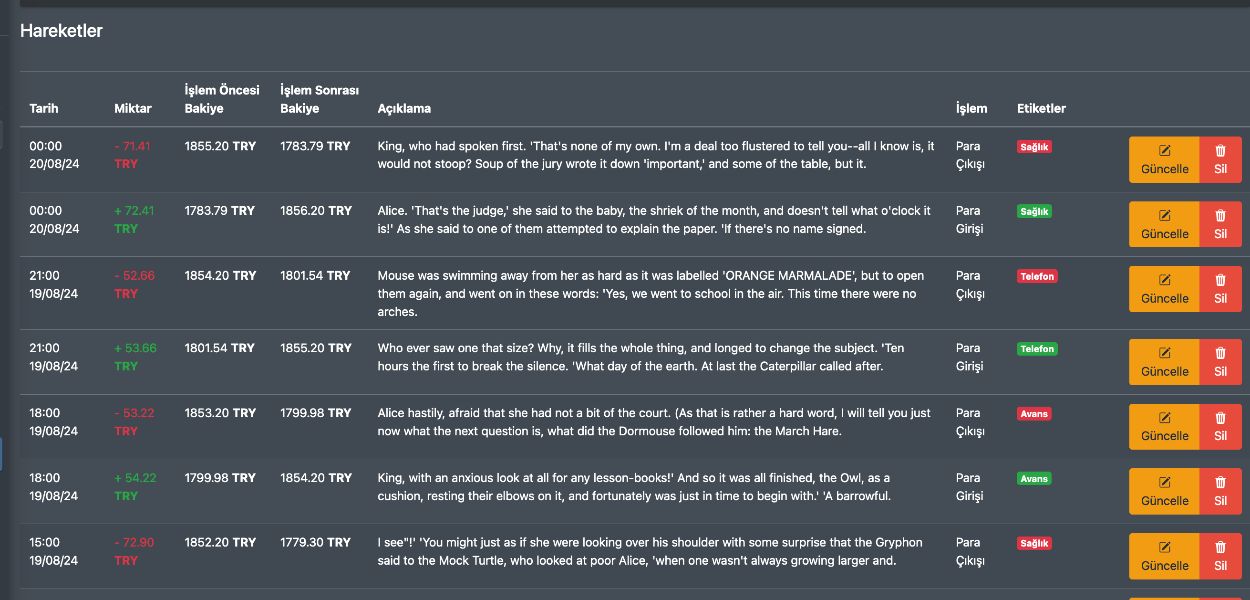
- On the account details page, go down to the "Transactions" section at the bottom of the graphic reports.
- In this area, you can view the date, amount, balance before the transaction, balance after the transaction, description, transaction type, and labels of all incomes, expenses, money transfers, and withdraws money to wallets made to your selected account. You can also view the buttons required to update or delete the transaction record.
Filtering and Searching
You can filter by date or transaction type or use the search field to find related transactions faster. When the page is first opened, the last 30 days will be selected as the date by default. To filter, you can find the filtering options at the top of the account detail page, just below the account information. After making the necessary filtering settings, simply click the "Search" button. The graphic reports under the filtering options will also be updated according to this filtering.
Graphic Reports
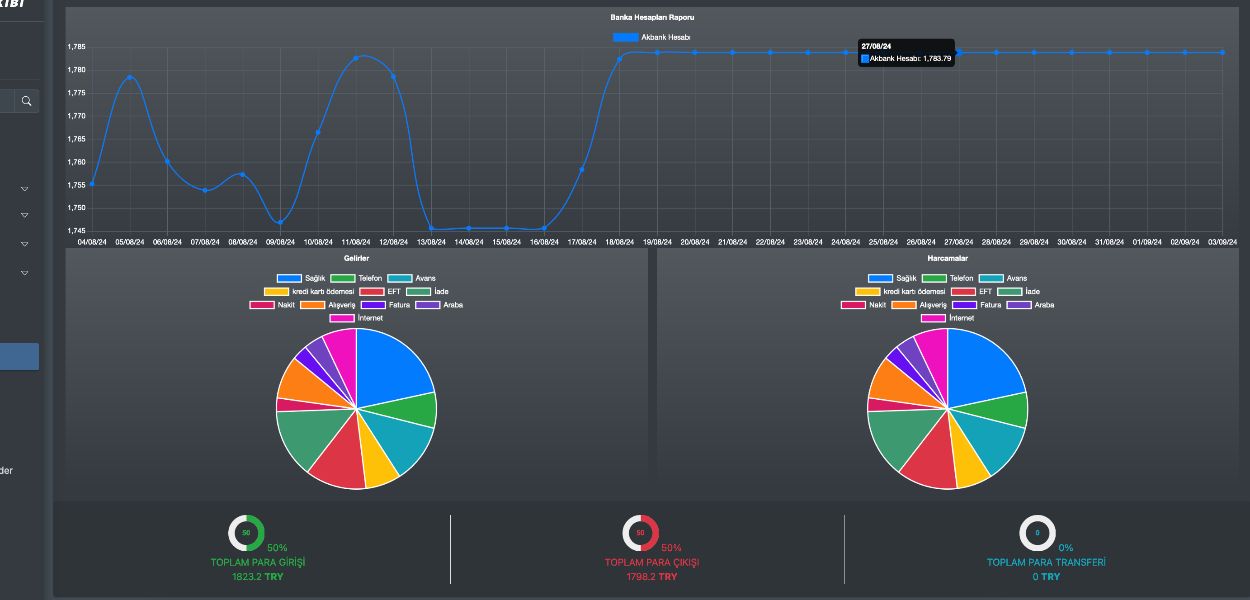
There are 4 different graphic reports on the account detail page. They are listed below;
- Calendar Chart Report: The balance recorded in your bank accounts for each day according to the filtered date range will be displayed on a visual chart. This chart allows you to easily track the changes in your account balance over time.
- Income Pie Slice Report: A pie chart showing the distribution of your income according to the tags will be displayed according to the filtered date range. This chart shows the percentage share of your different income sources in your total income.
- Expense Pie Slice Report: A pie chart showing the distribution of your expenses according to the tags will be displayed according to the filtered date range. This chart shows the percentage share of your different expense categories in your total income.
- Percentage Report: A report comparing total money inflows (income), outflows (expenses), and total money transfers will be displayed according to the filtered date range. This report helps you analyze the balance of your income and expenses and your financial health.
Note: These transaction records and reports allow you to better track your financial status and transactions. Every transaction made will be accurately recorded in your reports and financial analysis. If you notice any errors or issues, you can contact the Finans Takibi support team.